Despite a solid start on Black Friday, there are concerns if the retail sector can put in a solid December. The recent SpendingPulse survey shows that November sales increased by 0.8%. Some sectors are weak, sales of automobiles and home furnishings are off.
The sales in November did not last through the end of the month, leaving many in limbo about expectations for December in the retail sector. Only time will tell, if the American shopper -- already burdened with record debt -- will put retail sales in the plus column. Any way you shuffle the market deck; this is not the time to be rushing off to purchase retail stocks.
Retail season off to solid start: SpendingPulse
http://www.reuters.com/article/ousiv/idUSN1040366620071212

Thursday, December 13, 2007


Some Humor: Project Head Honcho
Project Head Honcho: The Citigroup CEO Search
A video on YouTube provides Citi some help with their CEO search:
A video on YouTube provides Citi some help with their CEO search:
IT Financial Sector Spending: The Future is Bright
Brief commentary in the recent Cisco (CSCO) conference call held in early November touched on the possibility of slowing IT spending in the financial sector looking into 2008. Even raising the specter of a reduction in financial IT spending caused the network equipment maker’s stock to slump immediately below $30.
Fortunately for Cisco the reality of financial sector IT spending appears to be much brighter. A survey by Wall Street & Technology and associated firms show that spending on equipment and labor will increase moving forward into 2008. Within the securities industry, nearly half of sell-side firms expect to increase their IT budgets from 11 to 30 percent in 2008. A similar situation in exists at buy side firms with more than a third planning to increase spending by 11 to 30 percent.
The banking sector demonstrates similar results with mid-sized banks leading the sector in spending increases. A good portion of spending by banks is driven by regulatory and compliance requirements while enhancing infrastructure maintenance.
Security still remains near the top of the list across the financial industry in terms of being an area where spending will continue to increase significantly. However there are bright spots in the report for core equipment manufacturers; data center infrastructure will be the focus of the majority of 2008 IT dollars at 82 percent of brokerage firms.
The survey shows an overall increase of more than 10% across the financial sector, rather than any type of decrease in spending. Certainly the picture is brighter than projected by many pundits watching the recent credit turmoil; maybe they need to go buy some shades to improve their vision during the sunny days ahead.
2008 IT Budgets Up More Than 10% for Financial Services Firms
http://www.wallstreetandtech.com/showArticle.jhtml;?articleID=204204039
Fortunately for Cisco the reality of financial sector IT spending appears to be much brighter. A survey by Wall Street & Technology and associated firms show that spending on equipment and labor will increase moving forward into 2008. Within the securities industry, nearly half of sell-side firms expect to increase their IT budgets from 11 to 30 percent in 2008. A similar situation in exists at buy side firms with more than a third planning to increase spending by 11 to 30 percent.
The banking sector demonstrates similar results with mid-sized banks leading the sector in spending increases. A good portion of spending by banks is driven by regulatory and compliance requirements while enhancing infrastructure maintenance.
Security still remains near the top of the list across the financial industry in terms of being an area where spending will continue to increase significantly. However there are bright spots in the report for core equipment manufacturers; data center infrastructure will be the focus of the majority of 2008 IT dollars at 82 percent of brokerage firms.
The survey shows an overall increase of more than 10% across the financial sector, rather than any type of decrease in spending. Certainly the picture is brighter than projected by many pundits watching the recent credit turmoil; maybe they need to go buy some shades to improve their vision during the sunny days ahead.
2008 IT Budgets Up More Than 10% for Financial Services Firms
http://www.wallstreetandtech.com/showArticle.jhtml;?articleID=204204039
Wednesday, December 12, 2007
WaMu on the chopping block: Can JPMorgan Chase really turn this bank around?
It was just a matter of time before banks started showing up on the auction block. The latest round of industry press indicates that WaMu may be the most likely candidate. There appears to be some synergy for JPM in this proposed scenario and it comes at a time where WaMu is running out of options. If JPMorgan Chase can actually turn Washington Mutual around this may come off as one of the better acquisitions in recent memory in terms of reasonable valuation.
Ahead of the Bell: JPMorgan Chase
Analyst Says JPMorgan Chase in Position to Make Major Acquisition in the Near Future
http://biz.yahoo.com/ap/071211/ahead_of_the_bell_jpmorgan_chase.html?.v=2
Ahead of the Bell: JPMorgan Chase
Analyst Says JPMorgan Chase in Position to Make Major Acquisition in the Near Future
http://biz.yahoo.com/ap/071211/ahead_of_the_bell_jpmorgan_chase.html?.v=2
Tuesday, December 11, 2007
Screening to Win: Williams %R
The overview below describes one of the common technical indicators – Williams %R and provides insights on how to utilize it in your stock selection. Hopefully this outline will provide traditional fundamental investors with some solid insight on how to incorporate technical indicators into their screening. The free HingeFire Stock Screener which can be found at http://www.hingefire.com is one of the few tools available that includes a wide selection of fundamental and technical criteria for selecting stocks. Using a combination of fundamental and technical screening is a powerful tool for winning in the market.
Williams %R
Williams %R Overview
The Williams %R was created by Larry Williams, and is useful for identifying overbought and oversold conditions in the market. The indicator shows the relationship of the current close in relation to the high-low range over a fourteen day period of time
Values above 80 are considered oversold while values below 20 are considered overbought. Note that this is the exact opposite of most oscillators that utilize a scale of 0 to 100.
The Williams %R Indicator is normally plotted inversely with 100 at the bottom and 0 at the top of the vertical axis. This is reverse of most oscillator graphs. Some charts present the indicator as running from -100 to 0
By the nature of its formation, the Williams %R indicator is generally quite choppy and active. Many times it will provide false signals, which is why investors should look for confirmation from charts or other indicators before entering a transaction.
The HingeFire tool provides support to incorporate Williams %R in your creation of screens for stocks. Users can scan to determine if the Williams indicator is greater than or less than the key 20 (overbought) and 80 (oversold) levels, and also establish if the Williams %R value has just crossed above (JCA) or below (JCB) these thresholds.
How to use Williams %R in screening
Most investors utilize the crossovers from Overbought and Oversold conditions when screening with the Williams %R indicator. Unlike other oscillators, many times crossing into an extreme is of interest rather then just crossing out of it.
Many times the Williams indicator demonstrates price pressure on the edge of an extreme leading to a cycle of higher or lower prices in the direction of the prevailing trend for the period of time. This leads investors to screen for just crossing into extremes below 20 (overbought) or above 80 (oversold); as well as crossing out of these conditions.
Crossing into oversold
Stocks crossing above 80 are considered oversold with Williams %R. Many stocks cross above this threshold and continue in the direction of the prevailing trend for considerable periods of time. Many investors correlate the cross into oversold territory with other technical indicators and use the combination to gauge short-term price momentum.
MFRI (MFRI Inc.) recently crossed again into oversold territory under 80 (plotted at the bottom). The previous cross into oversold territory on October 22nd led to a significant slide in the price of the stock over several weeks. The recent crossover could be setting the table for a similar occurrence.
Crossing into overbought
Stocks crossing below the 20 threshold are considered overbought in the Williams %R indicator. Many times crossing below this level can be a sign that the price increases may continue for a several week period of time; therefore many investors screen for this occurrence.
A fairly volatile stock APFC (American Pacific Corp.) had recently crossed below the 20 level placing it in overbought territory. The earlier cross below this level at the beginning of October demonstrates that this can many times herald the start of a short-term period of price increases while Williams %R remains below the 20 threshold (plotted at the top)
Crossing out of oversold
Many times excellent opportunities exist when the Williams %R indicator crossed below the 80 threshold indicating the stock is not longer oversold. Most traders correlate this change with other technical indicators to confirm the new trend. Some investors wait until the Williams oscillator crosses the 50 mark before acting on a trend reversal. The Williams %R indicator is choppy by nature and can easily reverse after crossing below extremes which is why it is important to wait for the new trend to develop.
A recent HingeFire screen found that DRIV (Digital River Inc) has just crossed below the 80 level exiting the oversold condition. Correlation with other indicators may indicate that the new trend of increasing prices rising is likely to remain in place for several weeks.
Crossing out of overbought
Another trend reversal scenario occurs when the Williams %R indicator crossed above the 20 level indicating the stock is no longer overbought. Correlation with other technical indicators often indicates opportunities where the price is likely to continue to drop in price over a several week period. This can enable investors to time solid entry points at short term troughs in price or look at shorting scenarios.
FUQI (Fuqi International Inc.)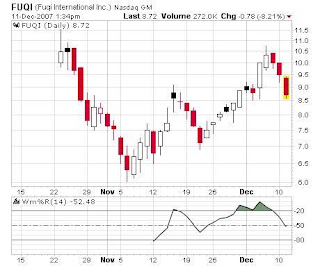 held its IPO in November. Since this time the stock has traded in a range of $6 to $11.50. Recently the Williams %R crossed above the 20 threshold exiting the overbought condition. Since this time the price of the stock has dropped by more then two dollars.
Williams Summary
Williams is similar to the stochastic indicator, however the 14 days Williams %R tends to be more choppy. This leads at times to false signals regarding trend reversals and breakouts; on the positive side the Williams indicator tends to be quick and does not lag greatly. This all gets back to a regular theoretical discussion regarding signal quality versus speed. Overall, it is important to use other technical indicators to confirm the action in the Williams %R before performing transactions.
Many investors use a 28 day version of Williams %R in charts for a smoother version with less false alerts.
The HingeFire tool supports users in screening for the following essential situations with the Williams %R Indicator:
Williams %R
Williams %R Overview
The Williams %R was created by Larry Williams, and is useful for identifying overbought and oversold conditions in the market. The indicator shows the relationship of the current close in relation to the high-low range over a fourteen day period of time
Values above 80 are considered oversold while values below 20 are considered overbought. Note that this is the exact opposite of most oscillators that utilize a scale of 0 to 100.
The Williams %R Indicator is normally plotted inversely with 100 at the bottom and 0 at the top of the vertical axis. This is reverse of most oscillator graphs. Some charts present the indicator as running from -100 to 0
By the nature of its formation, the Williams %R indicator is generally quite choppy and active. Many times it will provide false signals, which is why investors should look for confirmation from charts or other indicators before entering a transaction.
The HingeFire tool
 provides support to incorporate Williams %R in your creation of screens for stocks. Users can scan to determine if the Williams indicator is greater than or less than the key 20 (overbought) and 80 (oversold) levels, and also establish if the Williams %R value has just crossed above (JCA) or below (JCB) these thresholds.
How to use Williams %R in screening
Most investors utilize the crossovers from Overbought and Oversold conditions when screening with the Williams %R indicator. Unlike other oscillators, many times crossing into an extreme is of interest rather then just crossing out of it.
Many times the Williams indicator demonstrates price pressure on the edge of an extreme leading to a cycle of higher or lower prices in the direction of the prevailing trend for the period of time. This leads investors to screen for just crossing into extremes below 20 (overbought) or above 80 (oversold); as well as crossing out of these conditions.
Crossing into oversold
Stocks crossing above 80 are considered oversold with Williams %R. Many stocks cross above this threshold and continue in the direction of the prevailing trend for considerable periods of time. Many investors correlate the cross into oversold territory with other technical indicators and use the combination to gauge short-term price momentum.
MFRI (MFRI Inc.)
 recently crossed again into oversold territory under 80 (plotted at the bottom). The previous cross into oversold territory on October 22nd led to a significant slide in the price of the stock over several weeks. The recent crossover could be setting the table for a similar occurrence.
Crossing into overbought
Stocks crossing below the 20 threshold are considered overbought in the Williams %R indicator. Many times crossing below this level can be a sign that the price increases may continue for a several week period of time; therefore many investors screen for this occurrence.
A fairly volatile stock APFC (American Pacific Corp.)
 had recently crossed below the 20 level placing it in overbought territory. The earlier cross below this level at the beginning of October demonstrates that this can many times herald the start of a short-term period of price increases while Williams %R remains below the 20 threshold (plotted at the top)
Crossing out of oversold
Many times excellent opportunities exist when the Williams %R indicator crossed below the 80 threshold indicating the stock is not longer oversold. Most traders correlate this change with other technical indicators to confirm the new trend. Some investors wait until the Williams oscillator crosses the 50 mark before acting on a trend reversal. The Williams %R indicator is choppy by nature and can easily reverse after crossing below extremes which is why it is important to wait for the new trend to develop.
A recent HingeFire screen found that DRIV (Digital River Inc)
 has just crossed below the 80 level exiting the oversold condition. Correlation with other indicators may indicate that the new trend of increasing prices rising is likely to remain in place for several weeks.
Crossing out of overbought
Another trend reversal scenario occurs when the Williams %R indicator crossed above the 20 level indicating the stock is no longer overbought. Correlation with other technical indicators often indicates opportunities where the price is likely to continue to drop in price over a several week period. This can enable investors to time solid entry points at short term troughs in price or look at shorting scenarios.
FUQI (Fuqi International Inc.)
 held its IPO in November. Since this time the stock has traded in a range of $6 to $11.50. Recently the Williams %R crossed above the 20 threshold exiting the overbought condition. Since this time the price of the stock has dropped by more then two dollars.
Williams Summary
Williams is similar to the stochastic indicator, however the 14 days Williams %R tends to be more choppy. This leads at times to false signals regarding trend reversals and breakouts; on the positive side the Williams indicator tends to be quick and does not lag greatly. This all gets back to a regular theoretical discussion regarding signal quality versus speed. Overall, it is important to use other technical indicators to confirm the action in the Williams %R before performing transactions.
Many investors use a 28 day version of Williams %R in charts for a smoother version with less false alerts.
The HingeFire tool supports users in screening for the following essential situations with the Williams %R Indicator:
- Crossing into oversold – Williams crossing above 80.
- Crossing into overbought – Williams crossing below 20.
- Crossing out of oversold – Williams crossing below 80.
- Crossing out of overbought – Williams crossing above 20.
Combining indicators such as the Williams %R Index with other technical indicators enables investors to properly time entrance and exit opportunities in the market. The Williams Indicator support in the HingeFire Stock Screener combined with other fundamental and technical criteria provides a powerful tool to uncover prospects that can enhance your portfolio.
Monday, December 10, 2007
The National “Rah-Rah” Association is at it again
While the rest of the nation is facing the cold, harsh reality of the housing downturn, the NAR (National Associations of Realtors) is back in hype mode while trying support their membership. The trade group lifted its outlook for 2008 home sales and insisted the market is stabilizing. In fact its outlook for housing in 2008 suddenly appears to be outright rosy considering the current carnage.
Most other market analysts are not buying the NAR perspective however. “Numerous other economists, however, are far less optimistic than the trade group. They predict weak sales and falling prices through next year and beyond and emphasize that those problems could worsen if the economy sinks into a recession.”
The reality is that the U.S. is at least 18 months away from a housing recovery. Both home prices and sales will slide significantly in 2008 according to most economists that evaluate the sector. It will take more than NAR’s rose-tinted glasses to drag the housing market out of the abyss.
Realtors' Forecast Bucks Common Wisdom (not to mention common sense)
http://biz.yahoo.com/ap/071210/housing_forecast_realtors.html
Most other market analysts are not buying the NAR perspective however. “Numerous other economists, however, are far less optimistic than the trade group. They predict weak sales and falling prices through next year and beyond and emphasize that those problems could worsen if the economy sinks into a recession.”
The reality is that the U.S. is at least 18 months away from a housing recovery. Both home prices and sales will slide significantly in 2008 according to most economists that evaluate the sector. It will take more than NAR’s rose-tinted glasses to drag the housing market out of the abyss.
Realtors' Forecast Bucks Common Wisdom (not to mention common sense)
http://biz.yahoo.com/ap/071210/housing_forecast_realtors.html
Subscribe to:
Posts (Atom)